Problem Statement
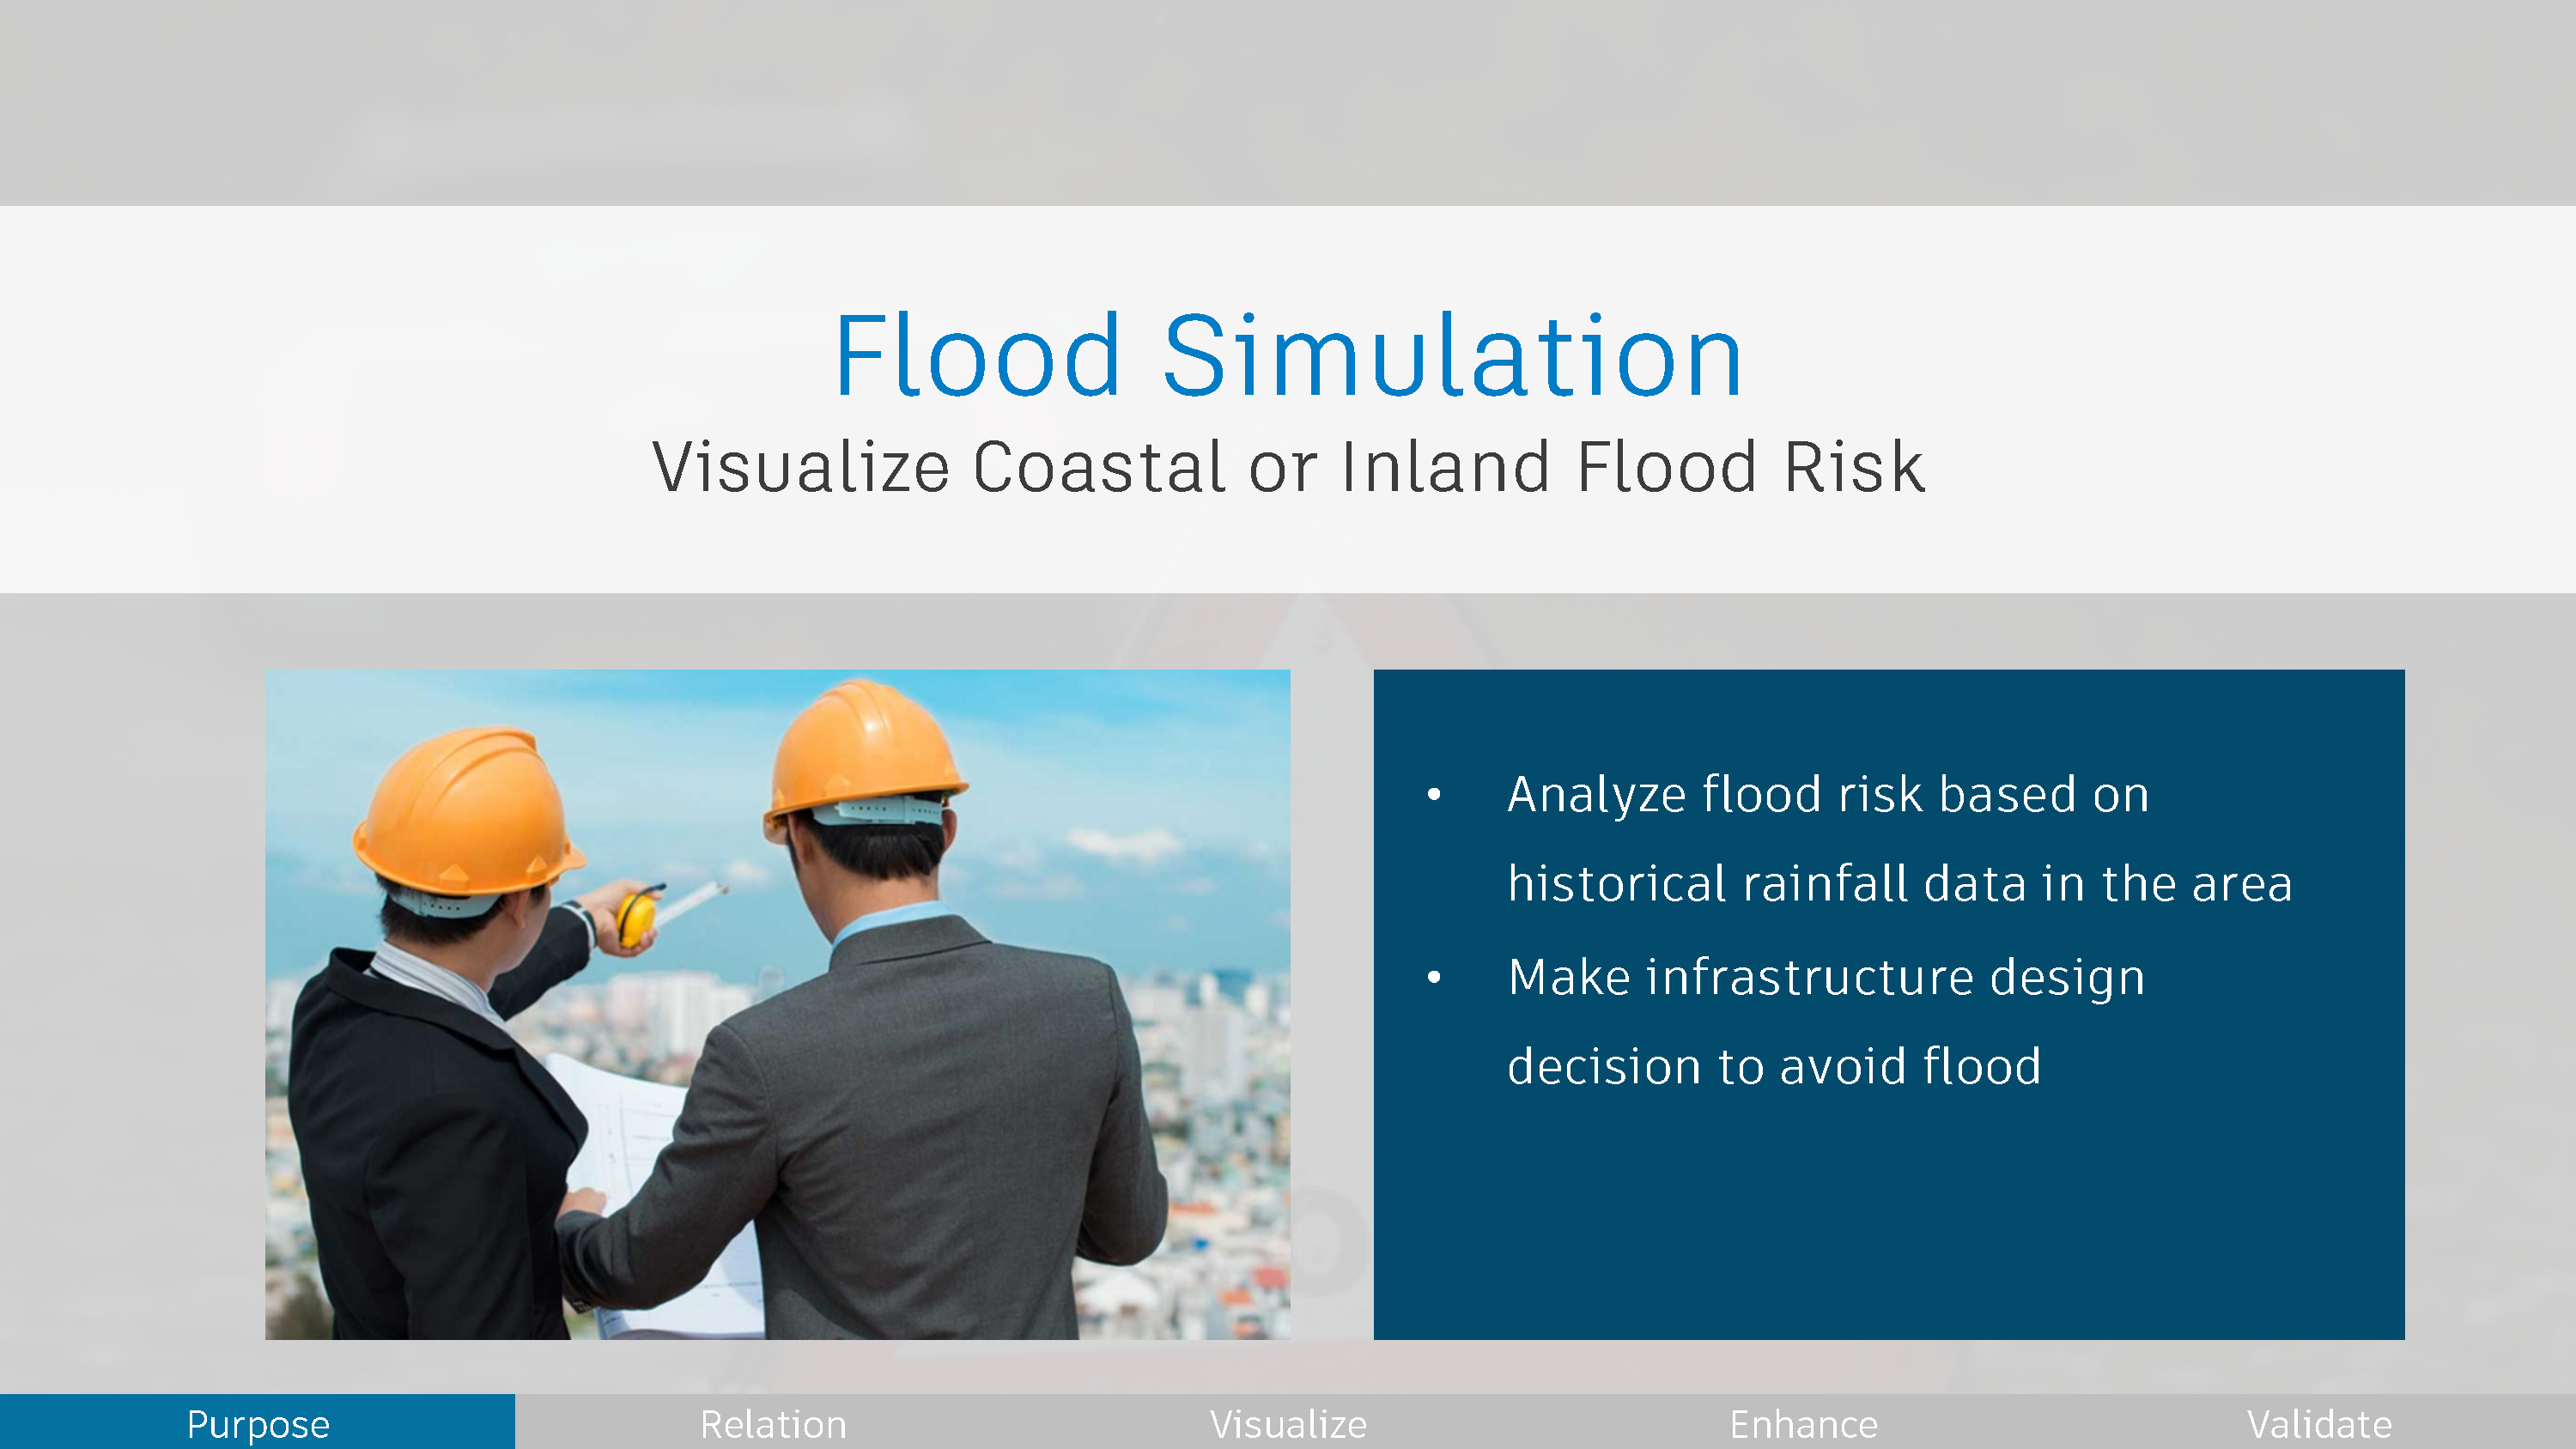
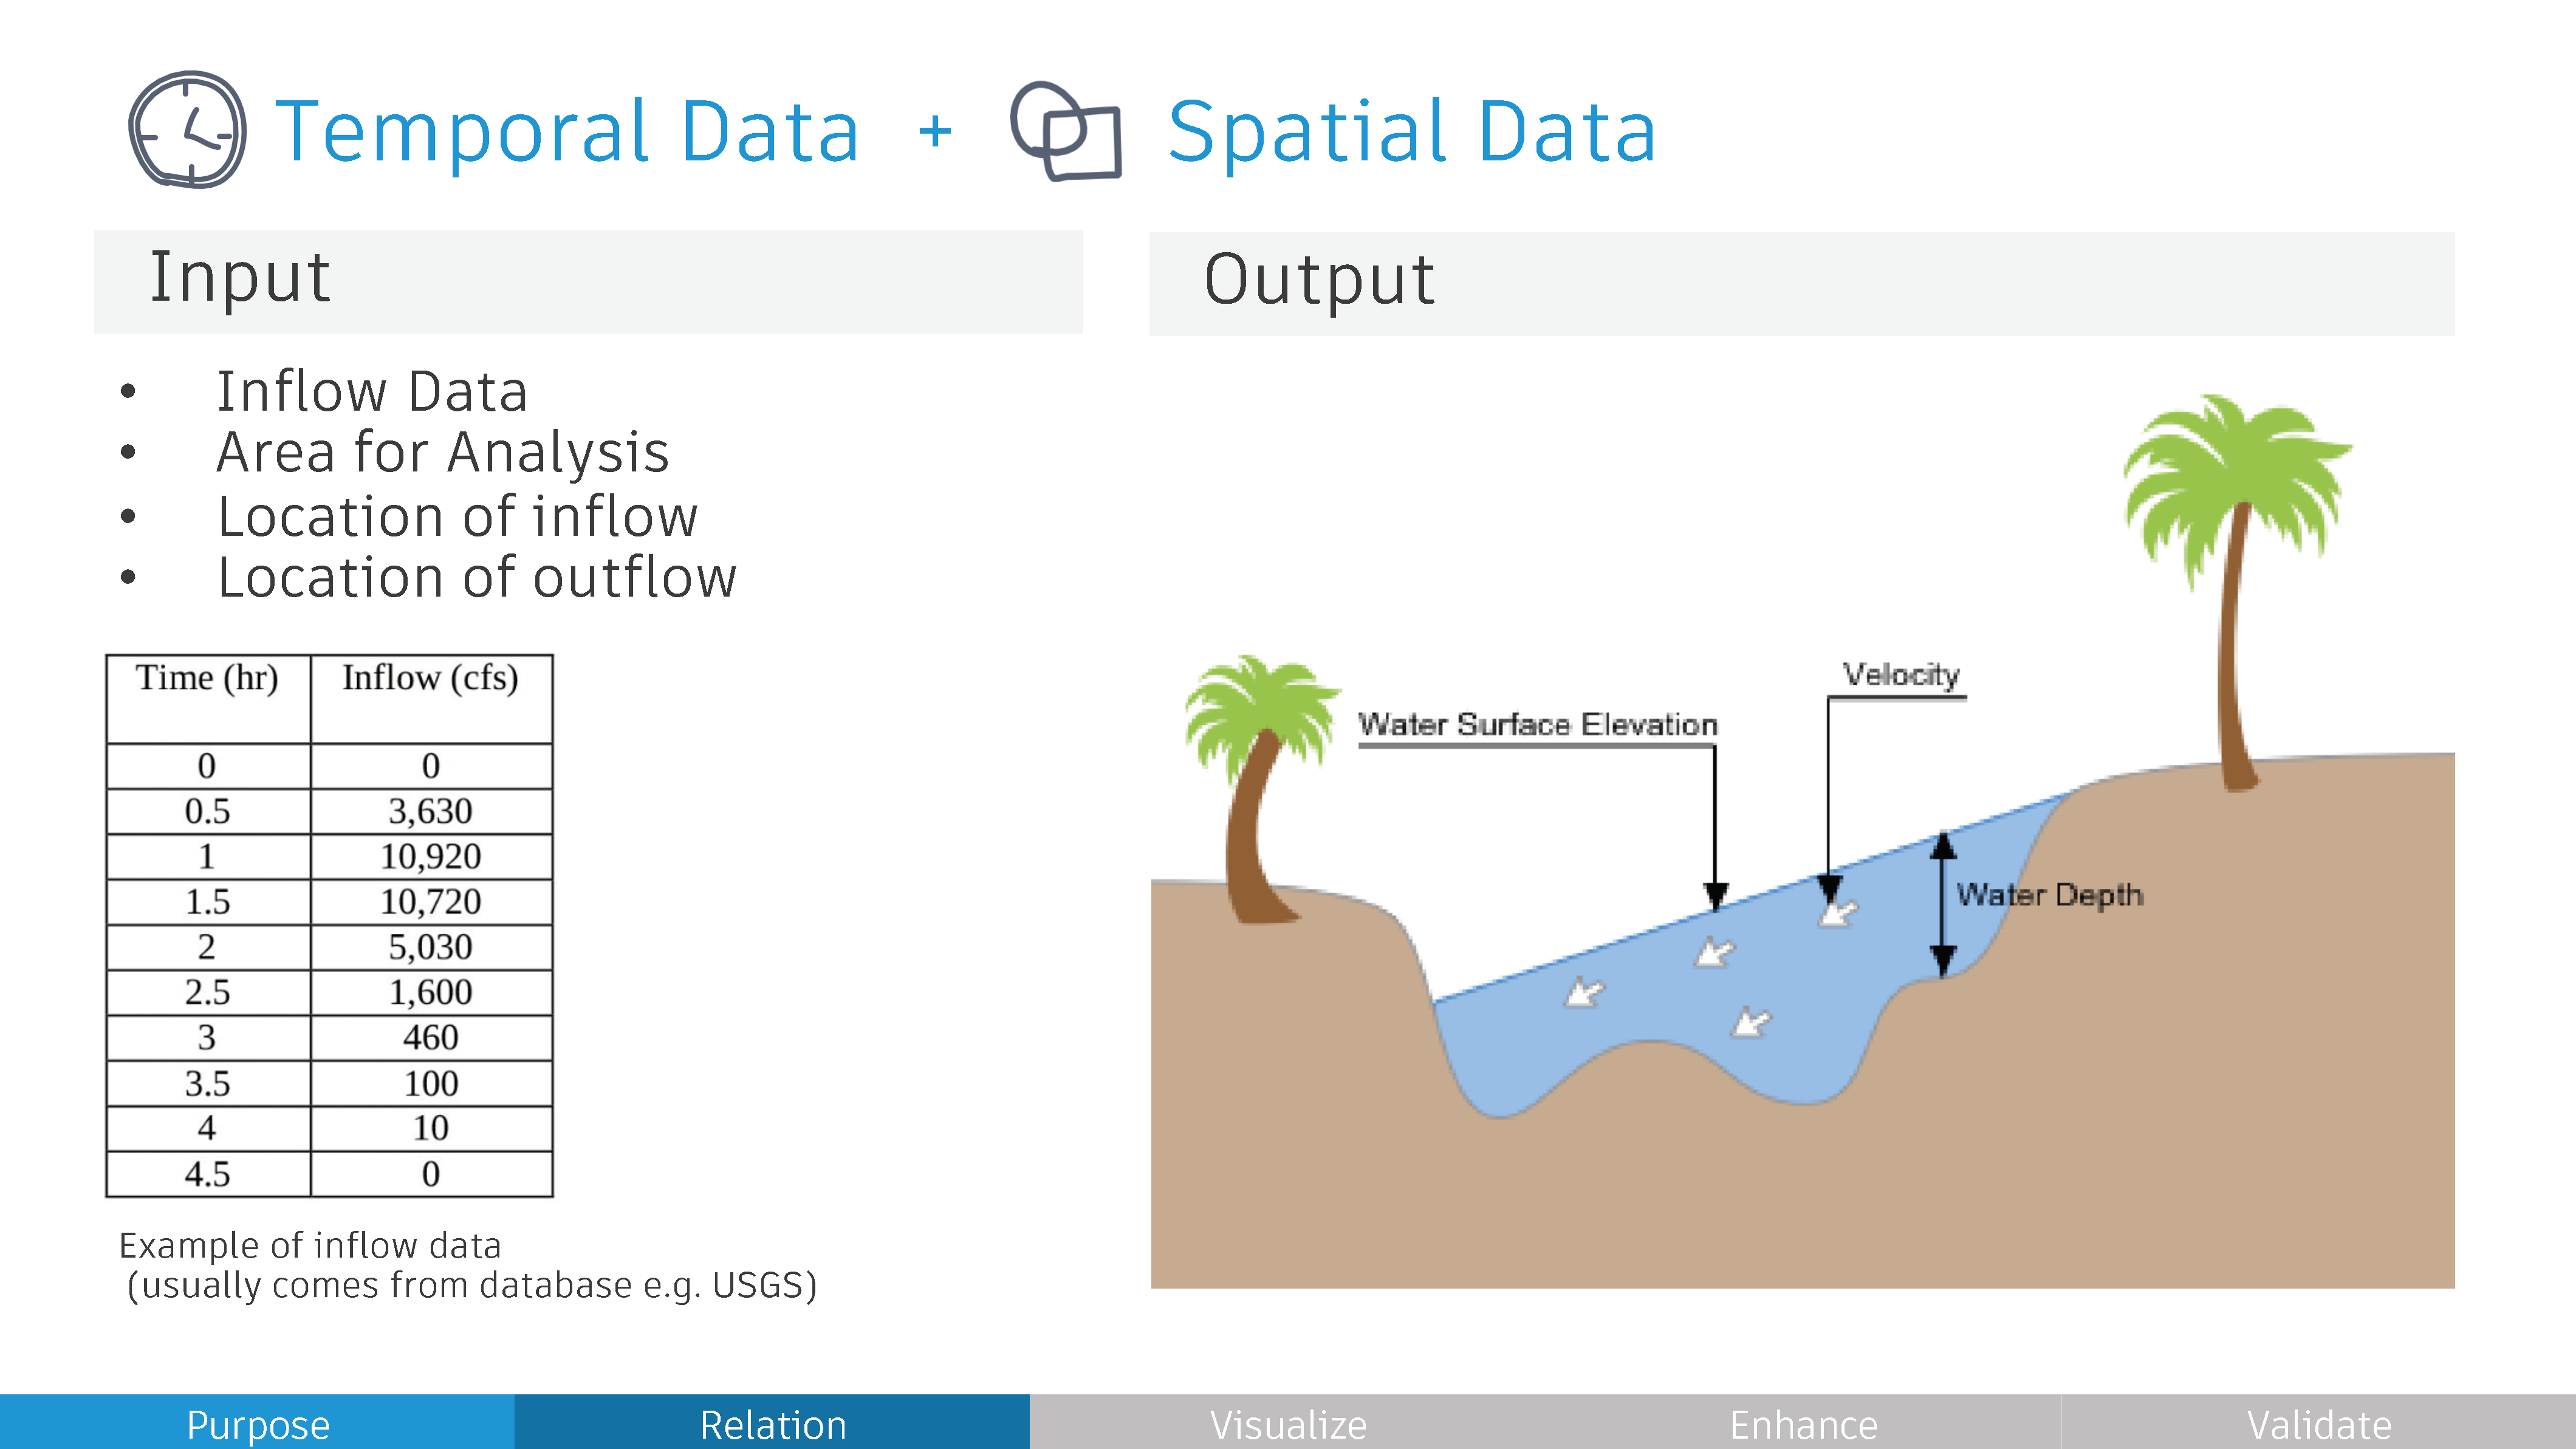
Civil engineers need to combine local rainfall data and geography condition to predict potential flood risk in certain region. They will make infrastructure design decision to avoid flood based on the flood risk analysis.
Traditionally this process has to be done by combining spreadsheets and calculating numbers, this can be a very tedious process going through pages of numbers.
Solution
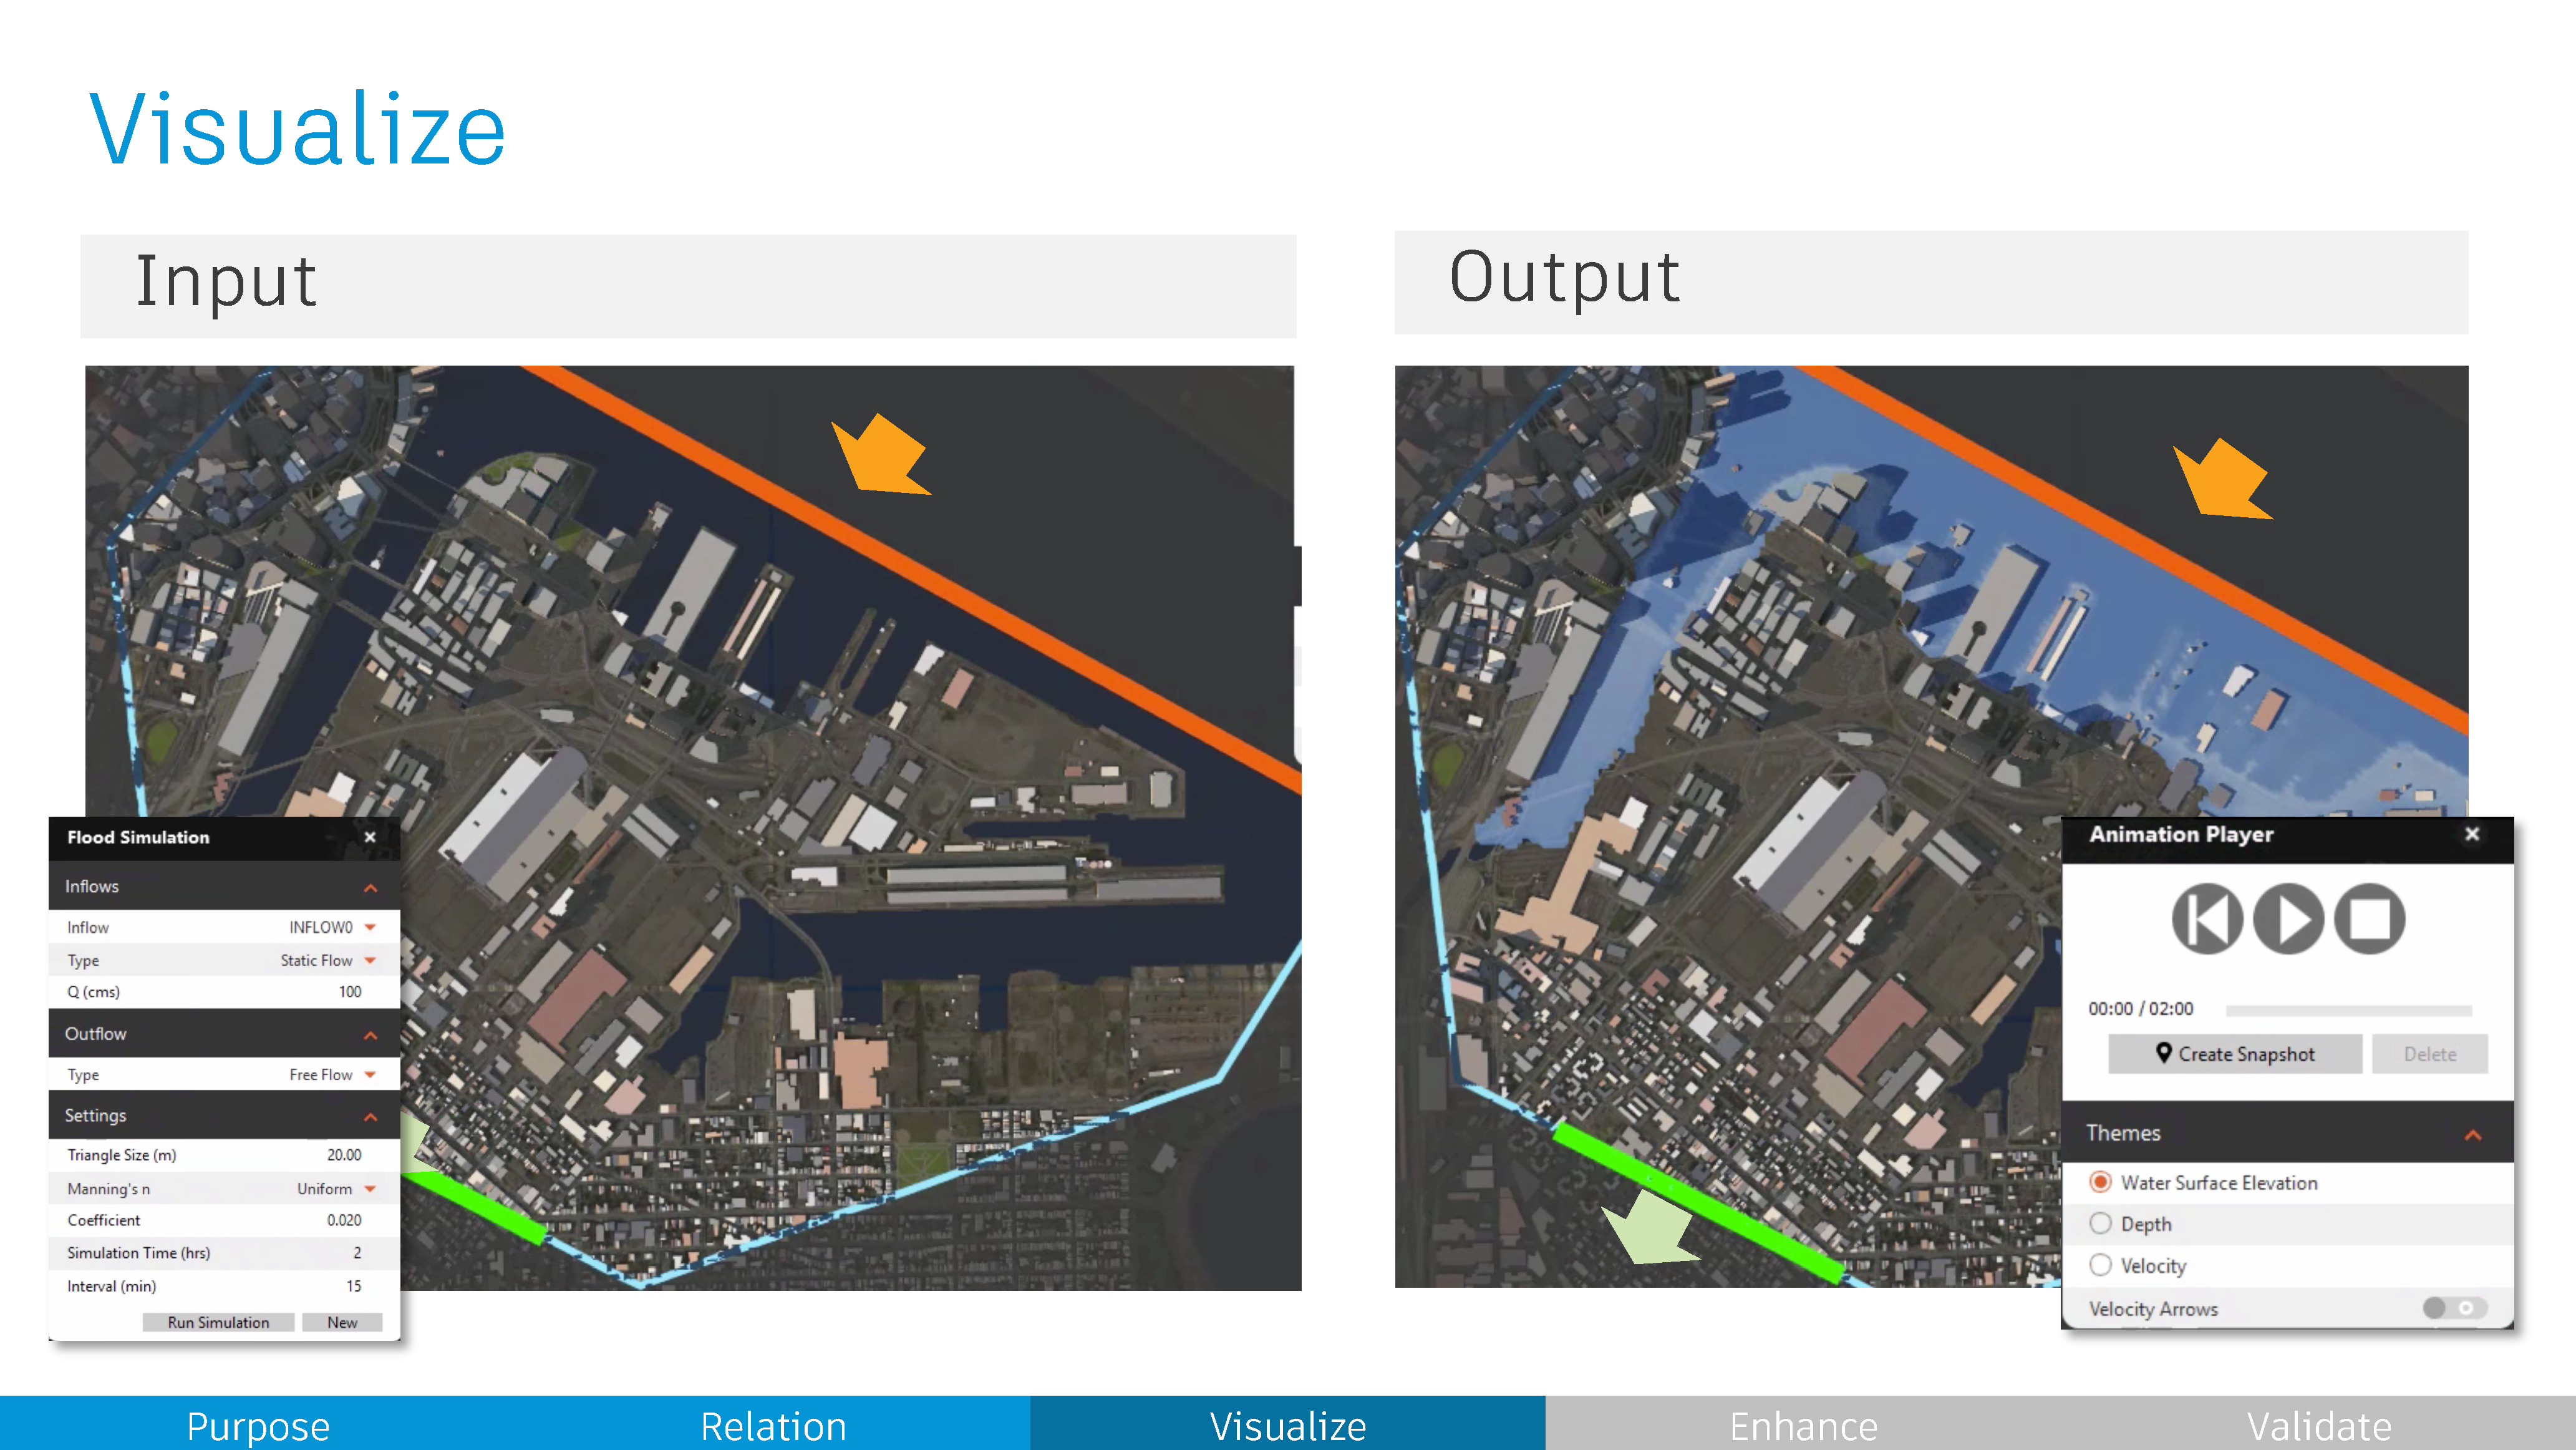
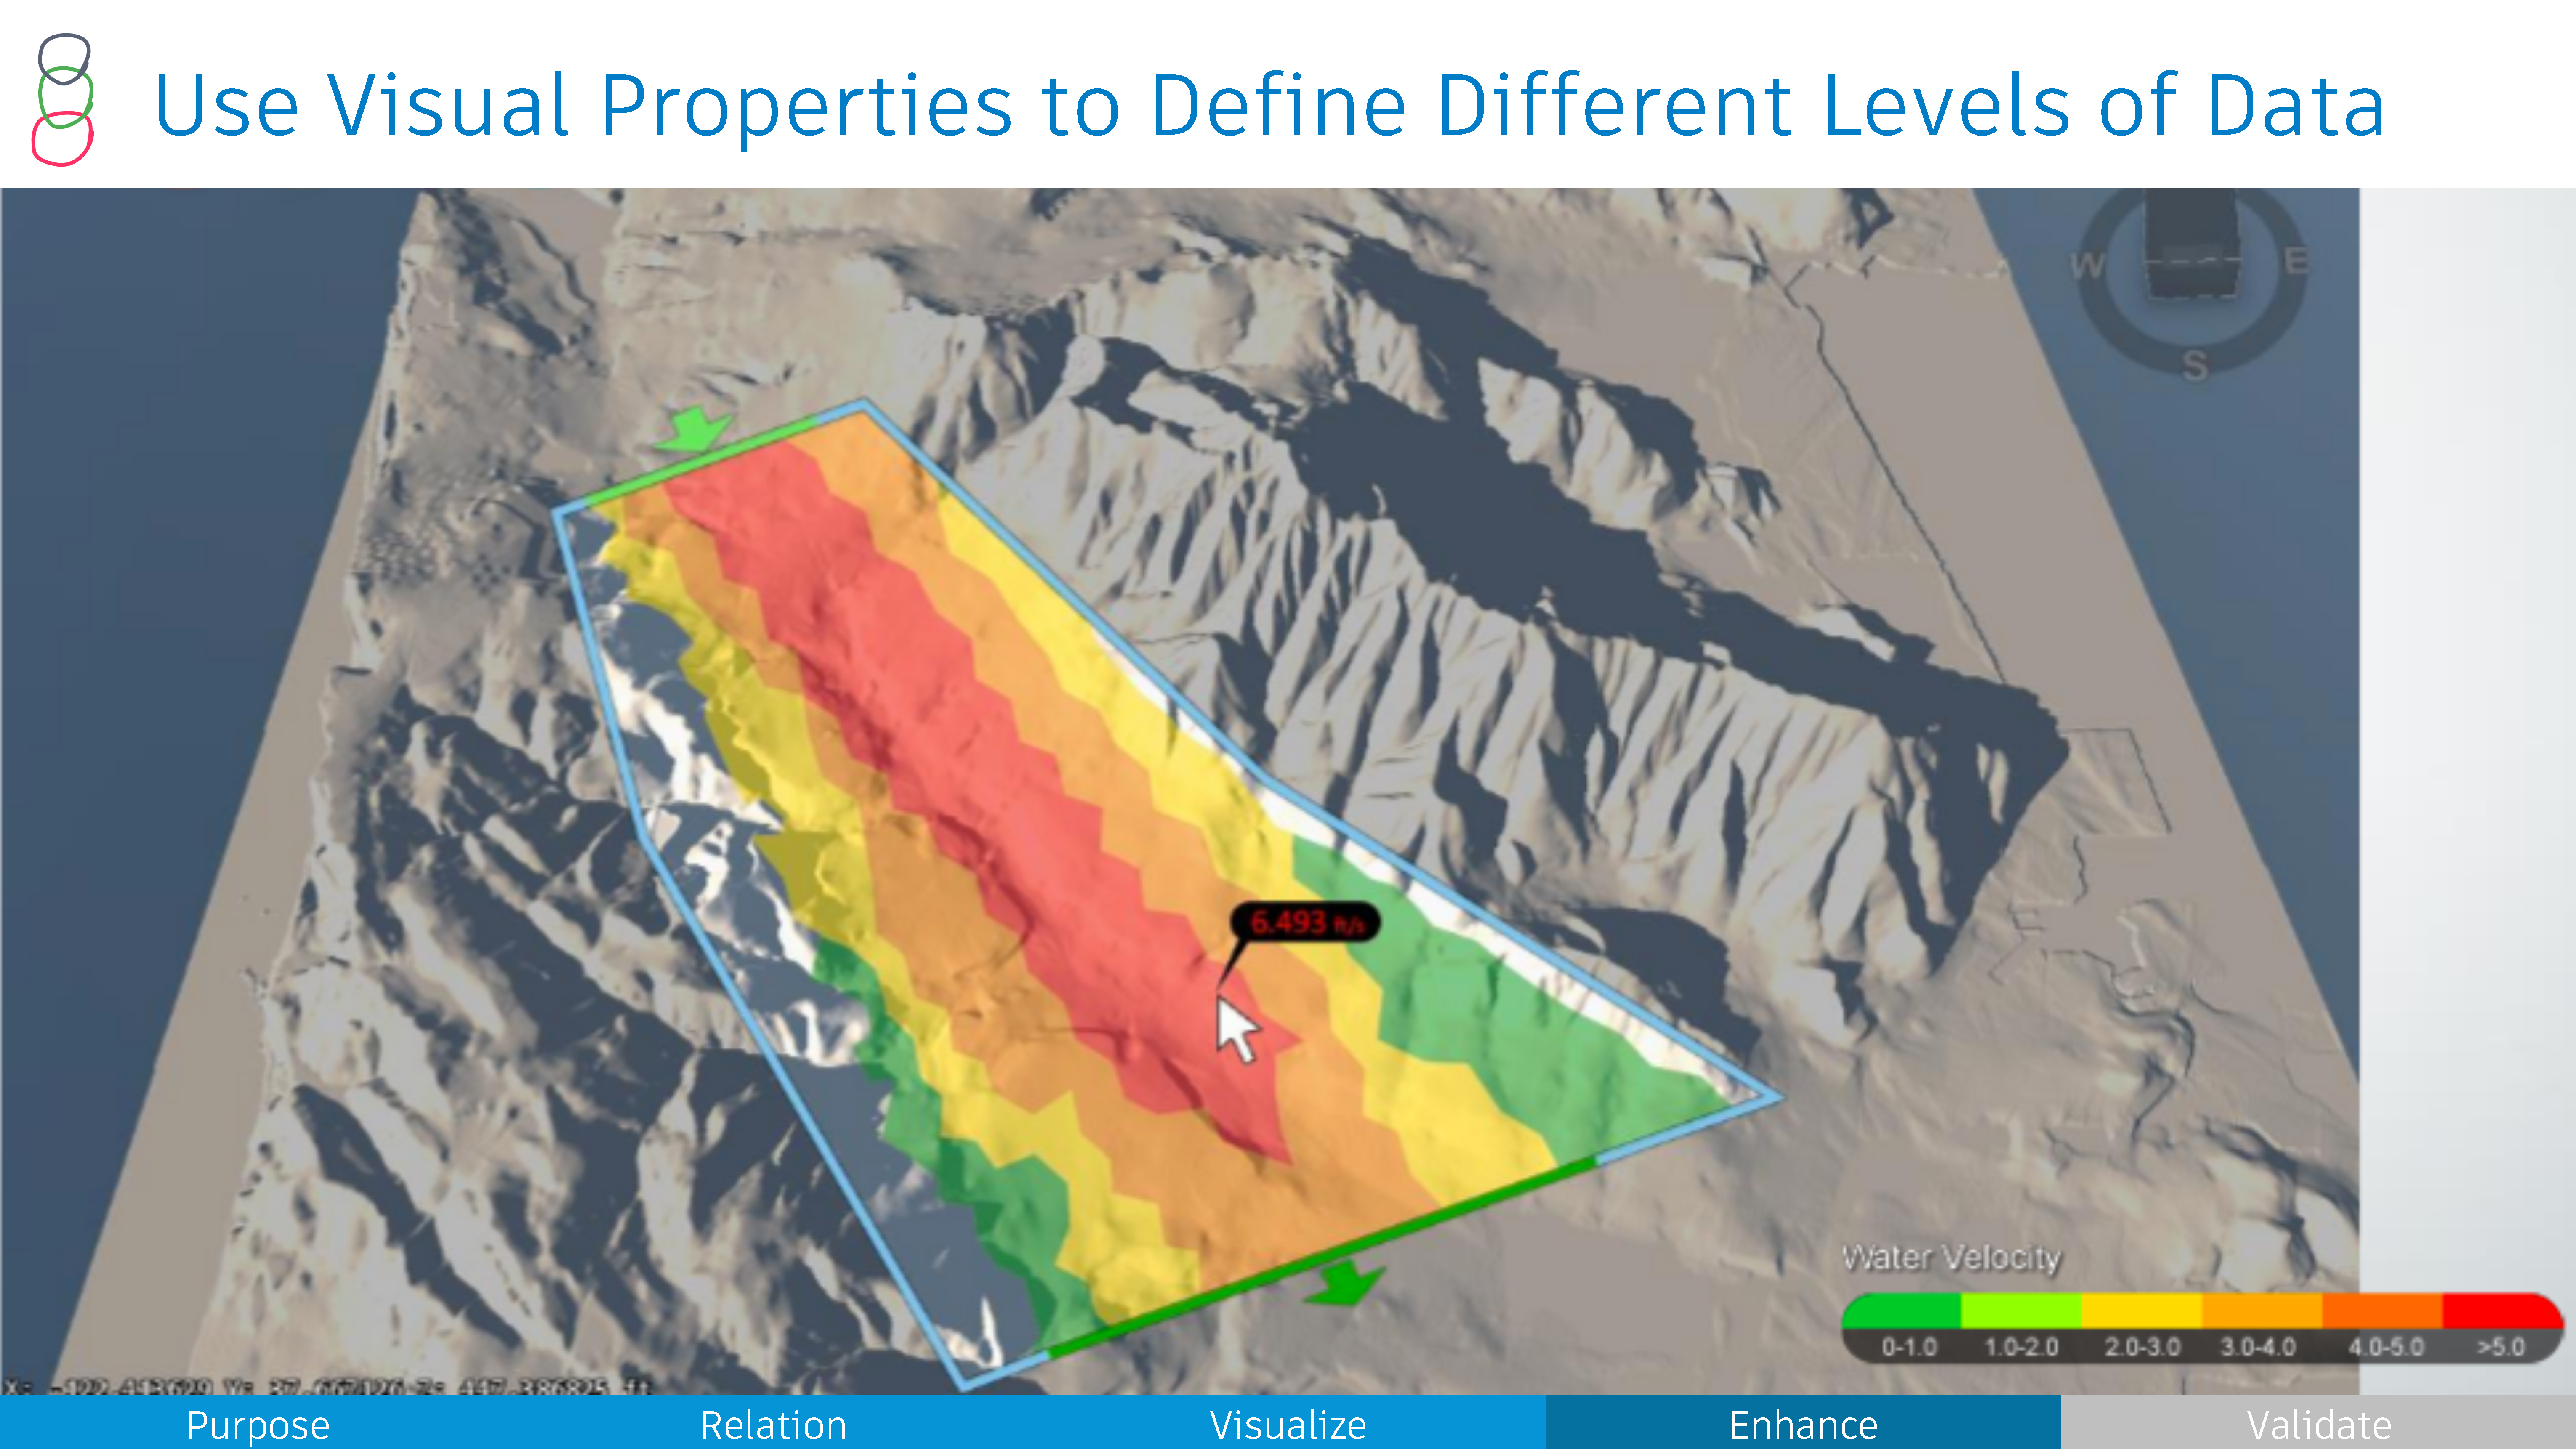
Visualizing flood data on a map can help improve the civil engineers understand the data more efficiently and generate better insights. With our software, we can visualize the flood risk not just as an image, but how they change overtime.
My Role
Designer for data visualization of rainfall data and flood risk analysis in InfraWorks, a preliminary design tool for civil engieers.
Evaluate design concept with customers.
Present the work at
Process

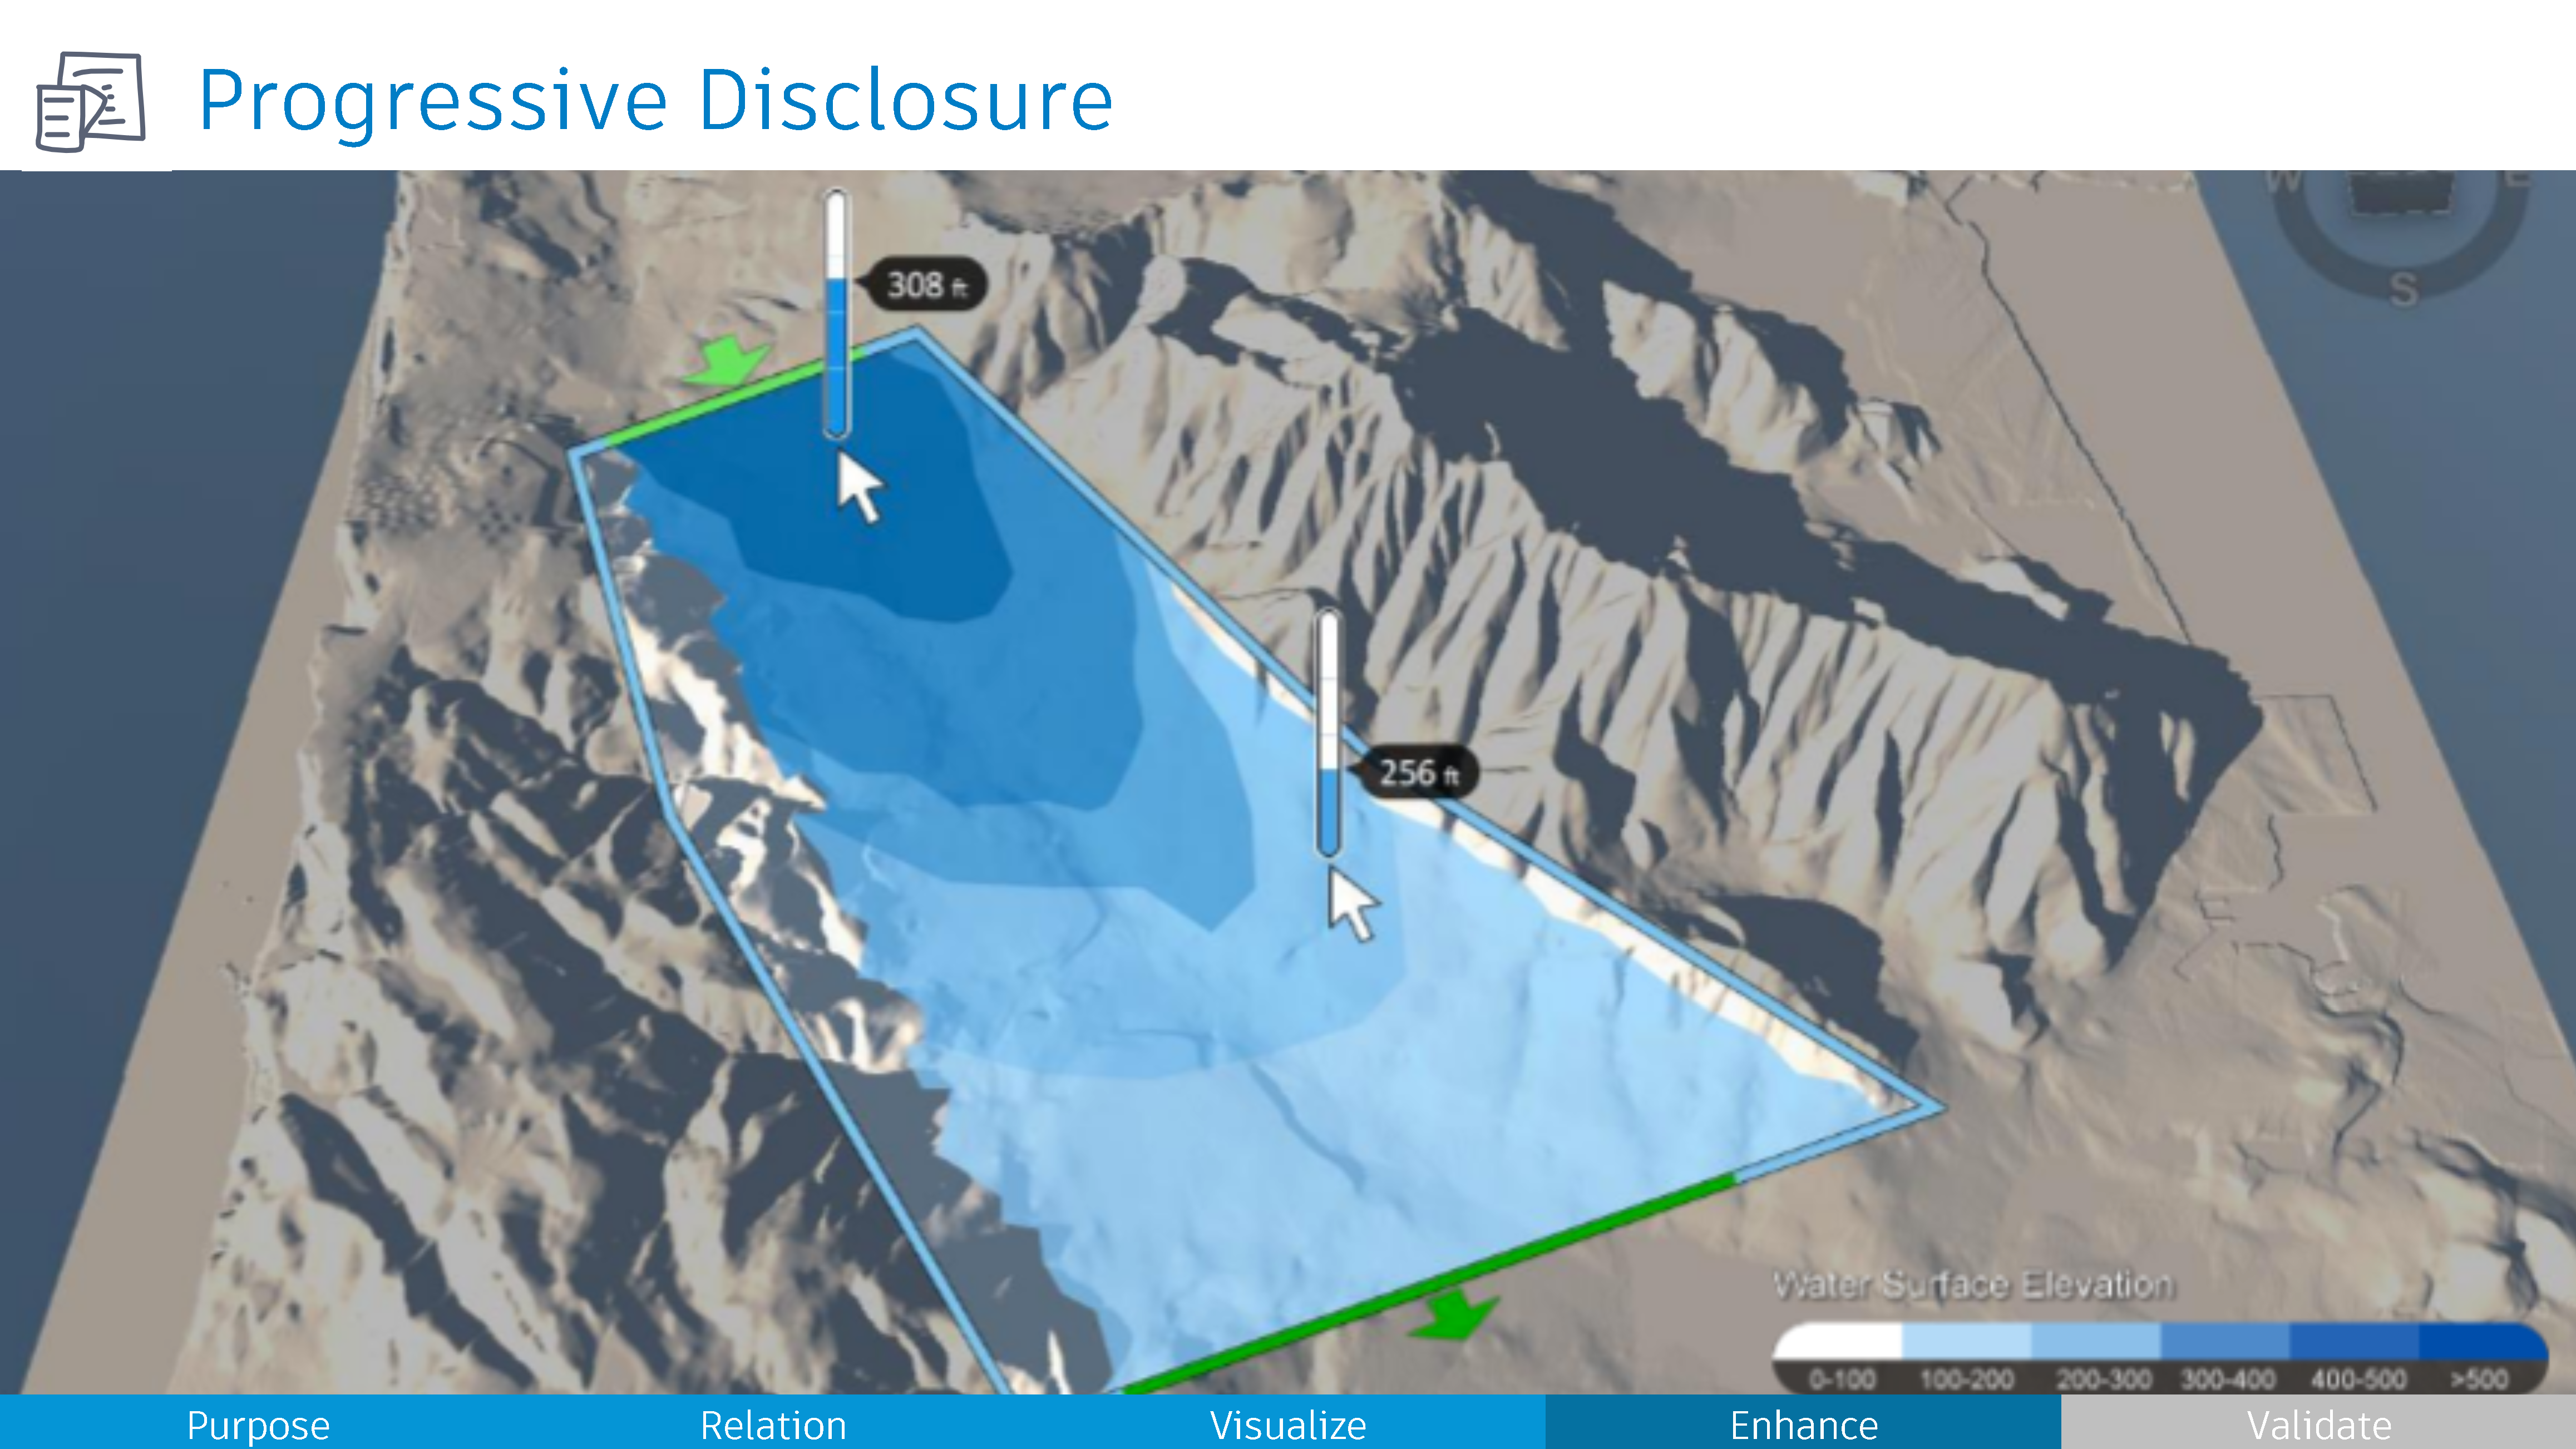

Result
Released feature has soon become one of the most popular feature in InfraWorks. Customer are still requesting new improvement most around customization of the calculation engine, the visualization part is a big success.

